SAP Commerce is a platform for building e-commerce websites and online stores. Kibana is a visualization tool for analyzing and understanding data stored in Elasticsearch, which is used to store log data in SAP Commerce.
To access Kibana in SAP Commerce, you need to login to the SAP portal and select the environment that you want to inspect. Then, you can open Kibana by clicking on the logging link, which will open Kibana in a new browser tab.
In Kibana, you can use filters to narrow down your search results and find specific log data. There are several types of filters available in Kibana, including the search filter, which allows you to search for specific text or phrases within your log data, and the search time filter, which allows you to specify a time range for your search. You can also use search filters to narrow down your search results based on specific criteria, such as log level, source, or message content
Access Kibana
- Login in SAP portal (https://portal.commerce.ondemand.com/) and select the environment which we want to inspect logs. sear
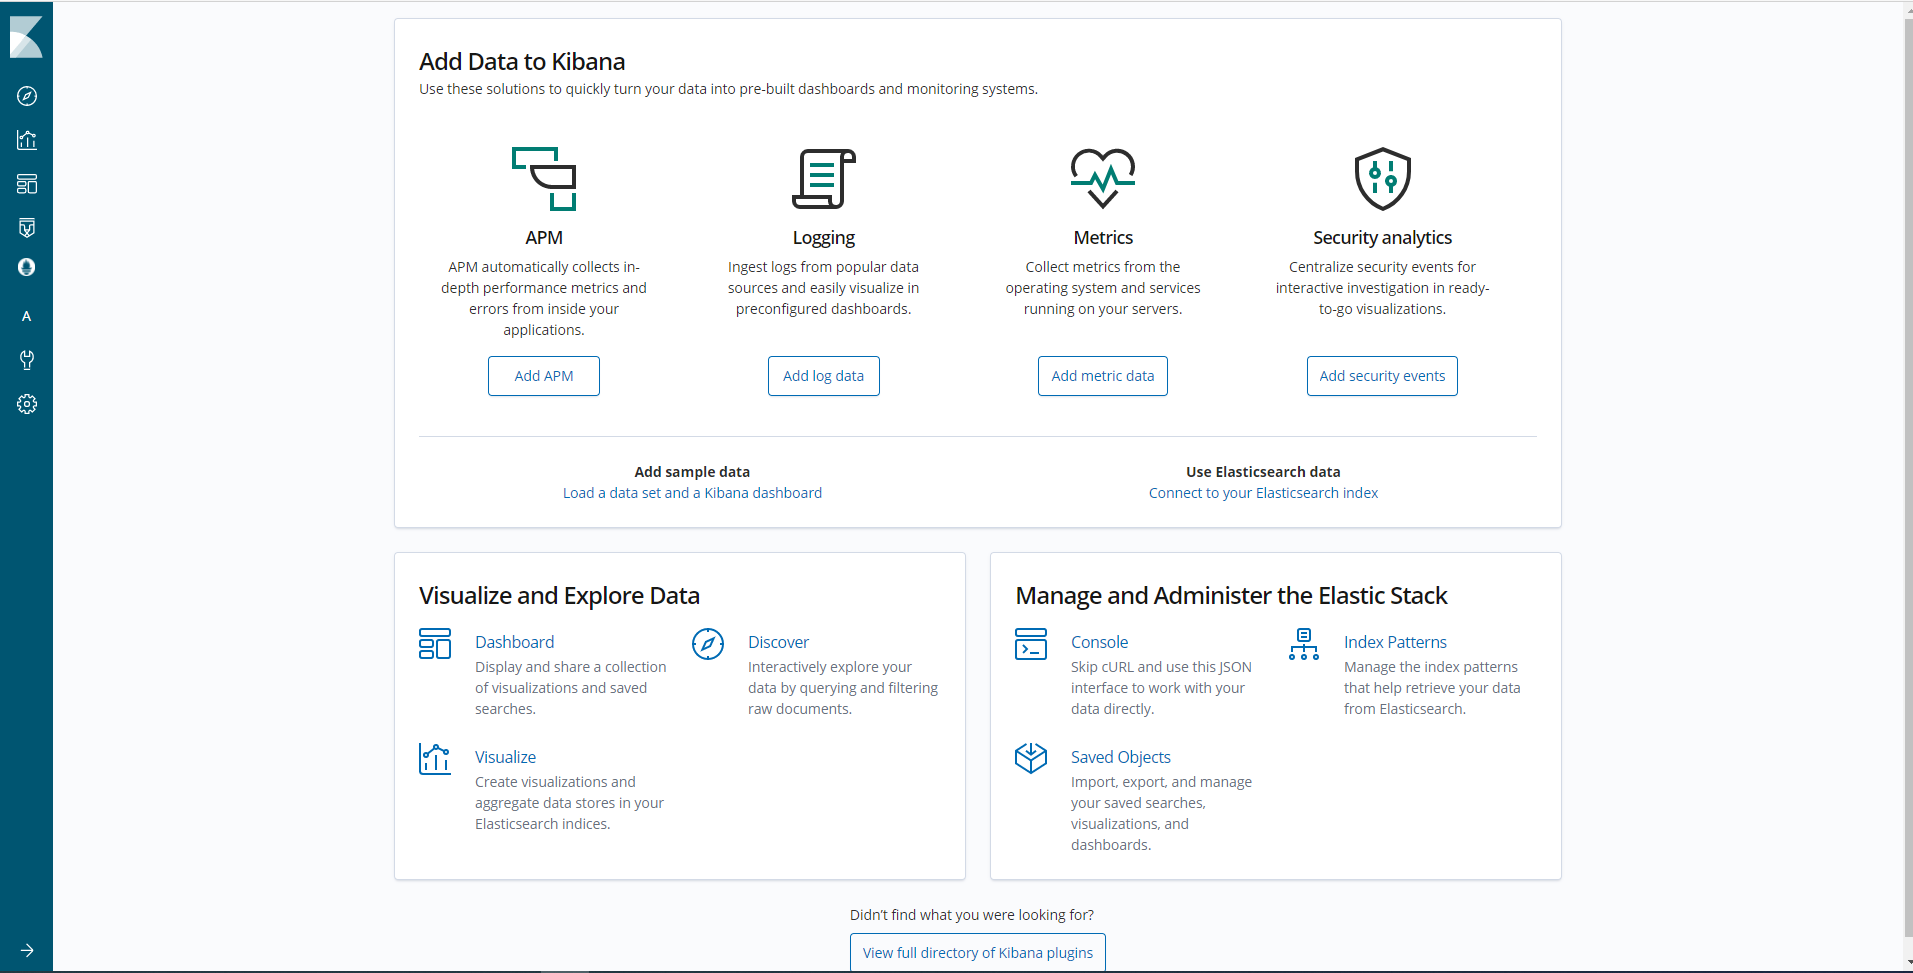
- Open logging link clicking the blue url. As a result Kibana will be open in a new browser tab.:

Well to known
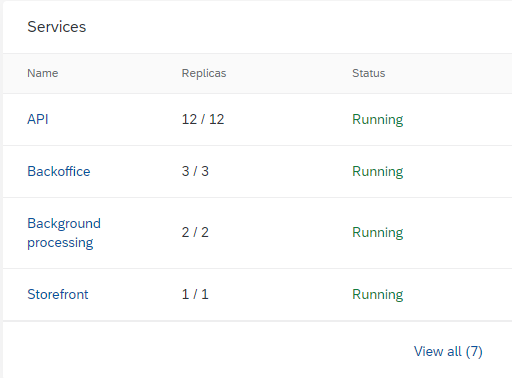
Pod: “Pods are the smallest deployable units of computing that you can create and manage in Kubernetes.”
Service:

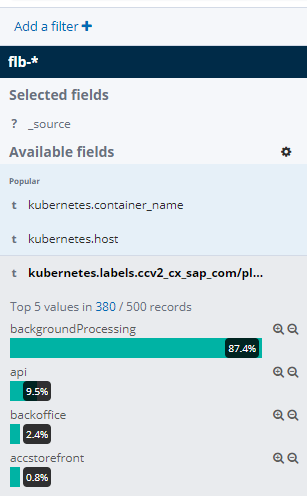
- api: OCC services
- This service likely refers to the SAP Commerce Order Capture Center (OCC) services, which provide a set of REST APIs for capturing and processing customer orders.
- backoffice: cockpit instances (OMS, admin, cms…)
- The backoffice service likely refers to the SAP Commerce Cockpit, which is a web-based interface for managing various aspects of the SAP Commerce platform, including the Order Management System (OMS), the administrative interface (admin), and the Content Management System (CMS).
- backgroundProcessing: cronjobs, hotfoders, order-process
- The backgroundProcessing service likely refers to a set of processes that run in the background to handle tasks such as executing cronjobs, monitoring hot folders, and processing orders.
- accstorefront:
- REST webservices used in product, price, categories import.
- This service likely refers to a set of REST APIs used to import product, price, and category information into the SAP Commerce platform.
- Hybris Front
- The Hybris Front service likely refers to the old SAP Commerce storefront, which has since been replaced by newer storefront implementations.
- REST webservices used in product, price, categories import.
Filters
Search
The search filter in Kibana allows you to search for specific text or phrases within your log data. You can use the search bar at the top of the Kibana interface to enter your search query, and Kibana will display any log entries that contain the specified text or phrase.

Hint:
- Wildcard:
*exampleDefault* - Search concrete phrase: wrap with
". Example:"MY search”
Search Time
The search time filter in Kibana allows you to specify a time range for your search. This is useful if you want to limit your search to a specific time period, such as the last 24 hours or the last week. To set a search time range, use the time picker at the top of the Kibana interface.

Auto-refresh: refresh logs files in certain amount of time.
Search Filters
The search filters in Kibana allow you to narrow down your search results based on specific criteria. For example, you might want to filter your search results based on the log level, the source of the log entry, or the message content. To use search filters, click the Add Filter button in the search bar, and then select the criteria you want to use to filter your search results.
Adding a search filter can be done in different ways. The first of them, sidebar. Here are found every filter related with the request in the selected range of time.
In the bar, there are three options:
- Add filter: add to visibility filter.

+Len: filter by this field-Len: exclude the selected value for this field.
Furthermore, the sidebar shows the ofter used filter as blue.

Every selected filter will be aggregated in the superior part, under the search bar.

La otra opción que encontramos en la barra lateral son los filtros de visión. Estos nos permitirán filtrar los campos mostrados en la vista rápida del dashboard:


Utility filters
Utility filters in Kibana are pre-defined filters that can be used to quickly narrow down your search results. For example, you might use a utility filter to show only error messages, or to show only log entries from a specific source. To use a utility filter, click the Add Filter button in the search bar, and then select the utility filter you want to use.
ccv2.cx.sap.com/platform-aspect : Get every pod logs for a service.
- api
- accstorefront
- backoffice
- backgroundProcessing
logs.message: "exists" : Remove every empty message. The main objective is get a board as similar as a development console. Resulting tag:

logs.message y logs.level : logs shown in development console.

Example
To use the filters in Kibana to search for specific log entries, you can follow these steps:
- Open Kibana and select the index pattern that contains the log data you want to search.
- Use the search bar at the top of the Kibana interface to enter your search query.
- Use the time picker to specify a time range for your search, if desired.
- Use the Add Filter button to add any additional filters you want to use to narrow down your search results.
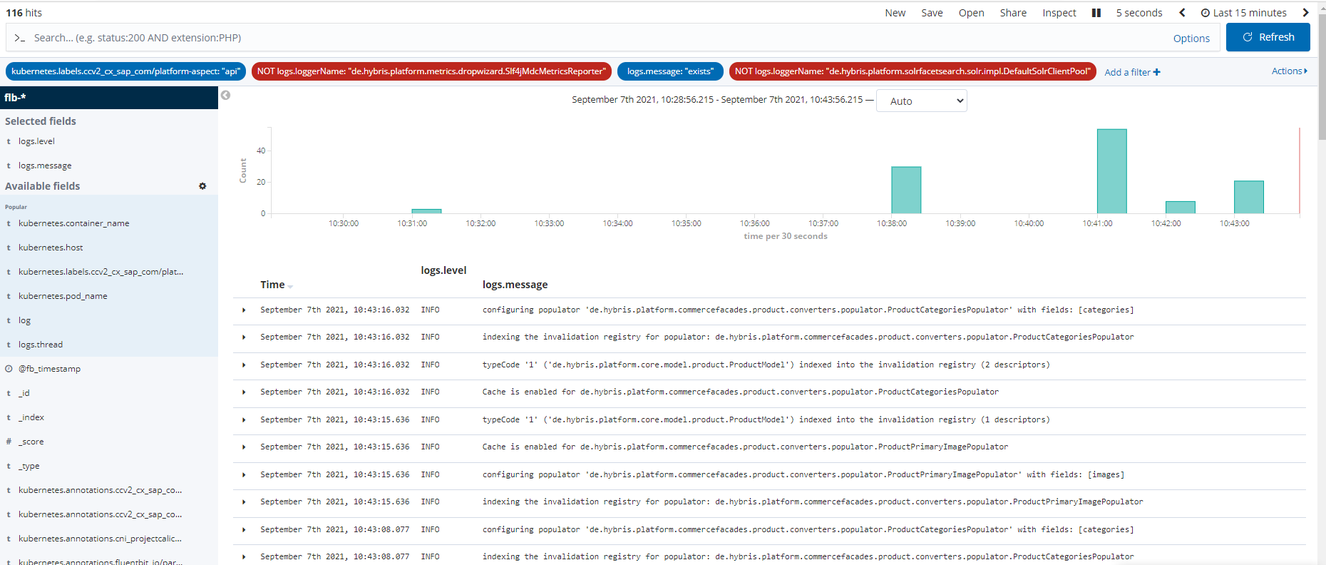
- Select the aspect that generate this logs (
kubernetes.labels.ccv2_cx_sap_com/platform-aspect: "api") andlog.message: "exists - Click the Run Search button to execute your search and display the results in the Kibana interface.
The resulting search results should show all log entries that follows the previous criteria, as shown in the following screenshot:

Kibana is a data visualization and analysis tool used to analyze and understand data stored in Elasticsearch. It is commonly used to store log data, and can be accessed through the SAP portal by logging in and selecting the environment to inspect, and then clicking on the logging link.
Kibana is a powerful tool for analyzing and understanding data stored in Elasticsearch, and can be useful for troubleshooting issues and identifying patterns in log data within SAP Commerce.